Nginx Log Collection
APO leverages the Vector + ClickHouse logging solution to achieve an out-of-the-box, efficient, and low-cost experience. This document explains how to use APO's logging features to create a stunning NGINX request analysis dashboard.
Preview:
- Overview of Requests and Latency Analysis
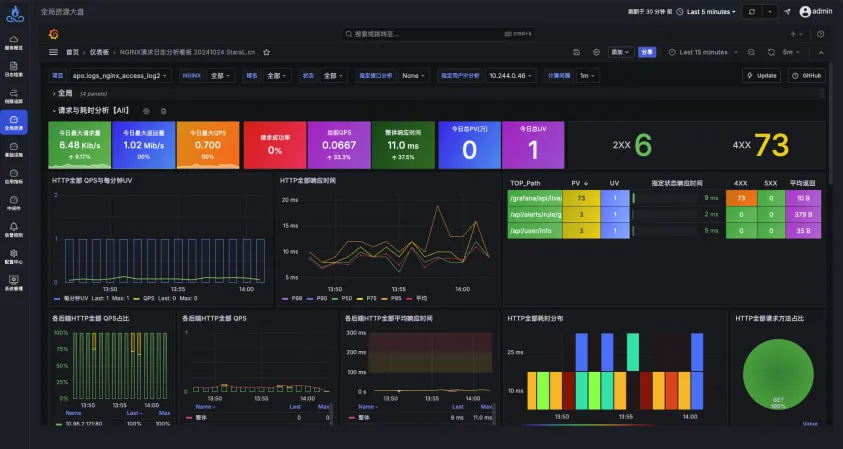
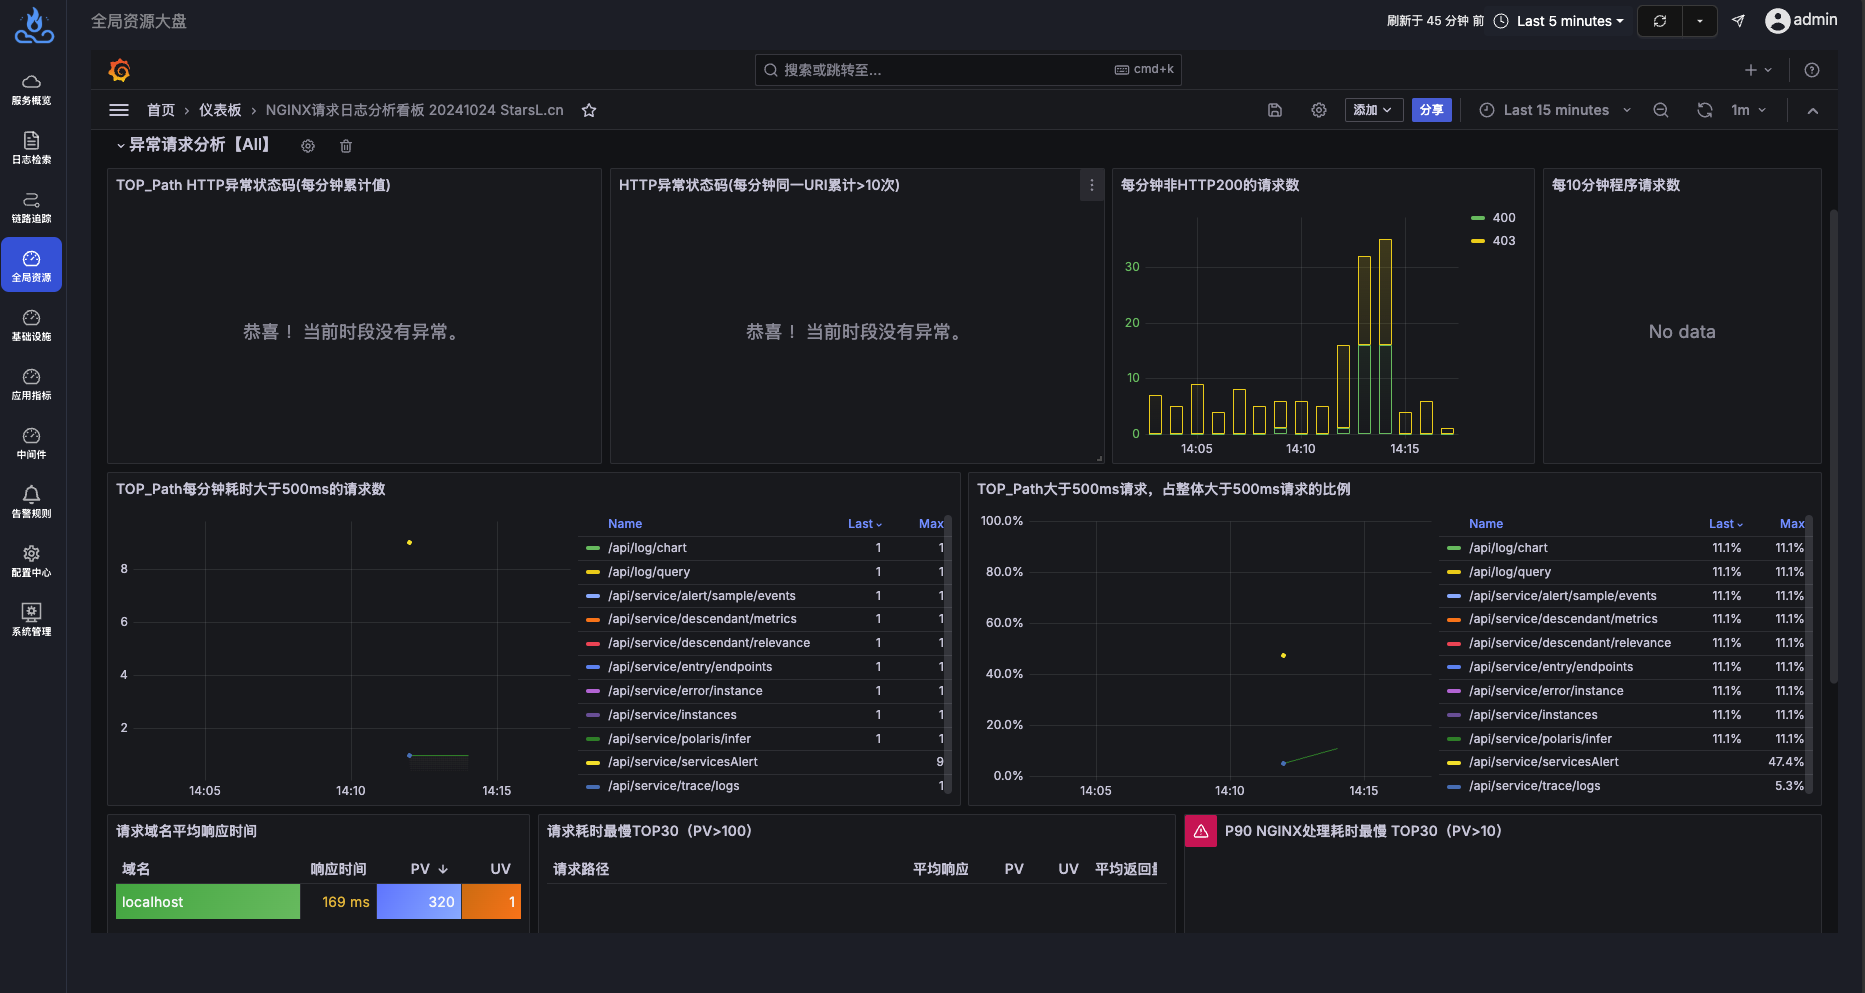
- Analysis of Abnormal Requests
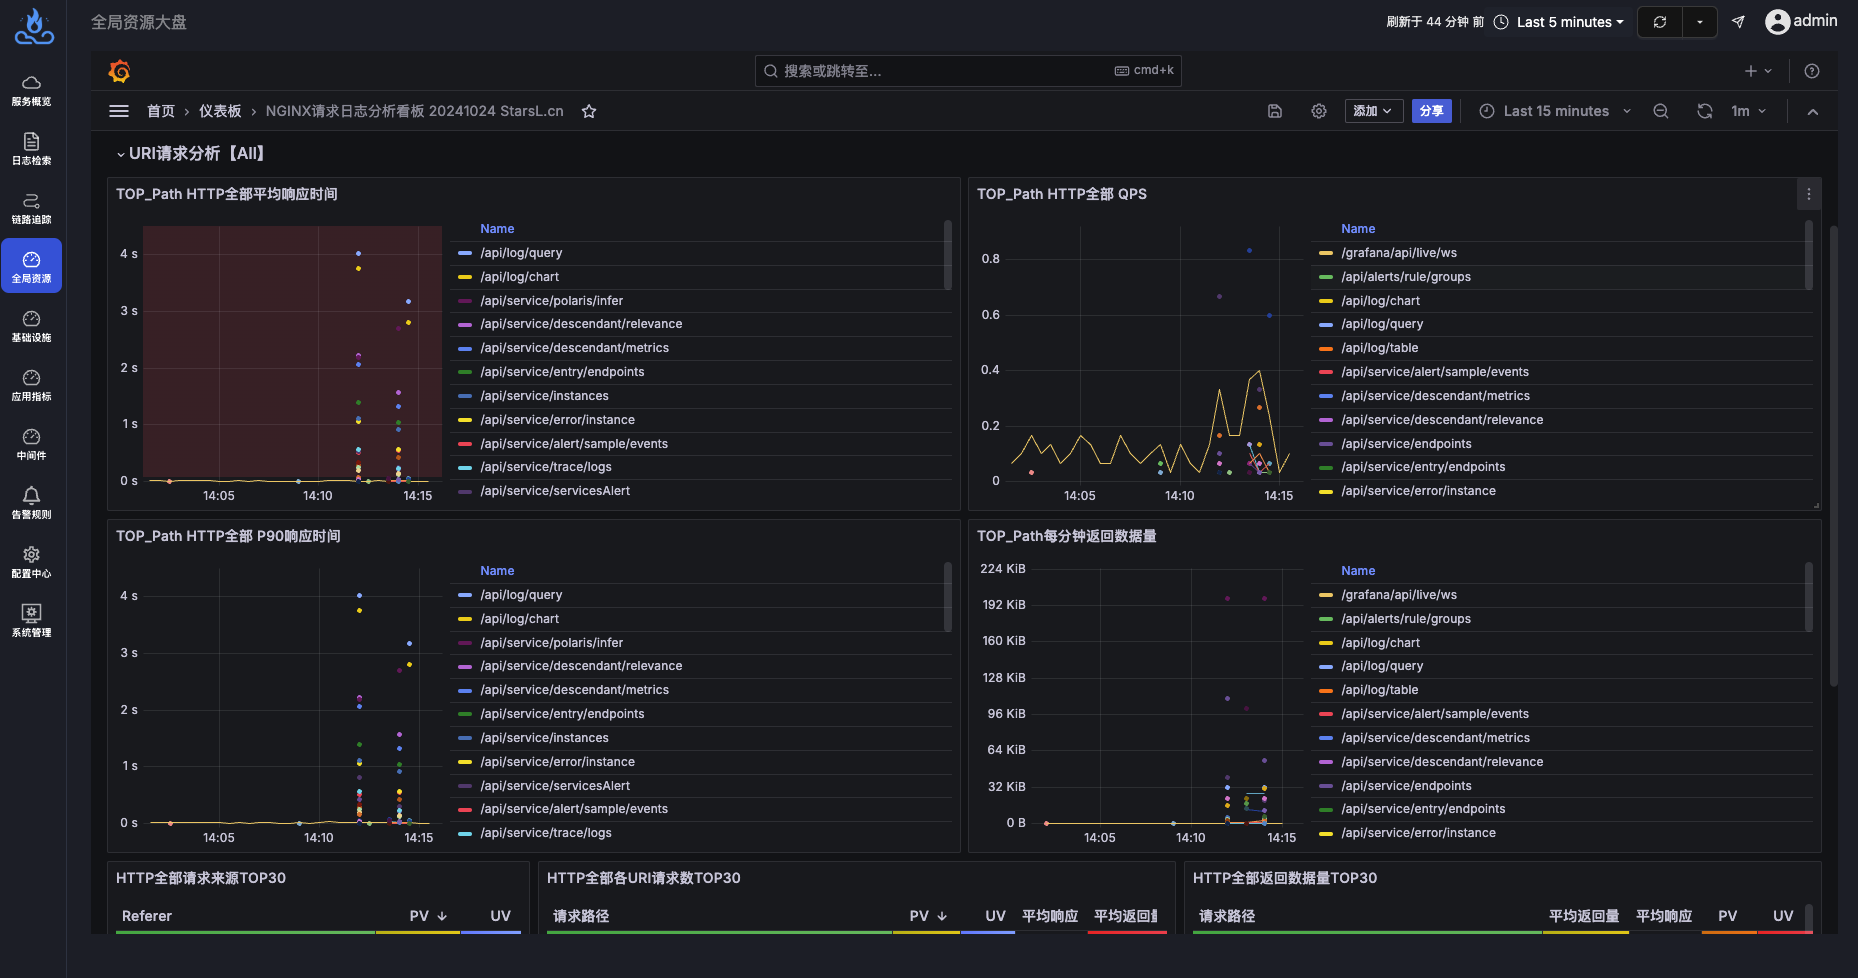
- URI Request Analysis
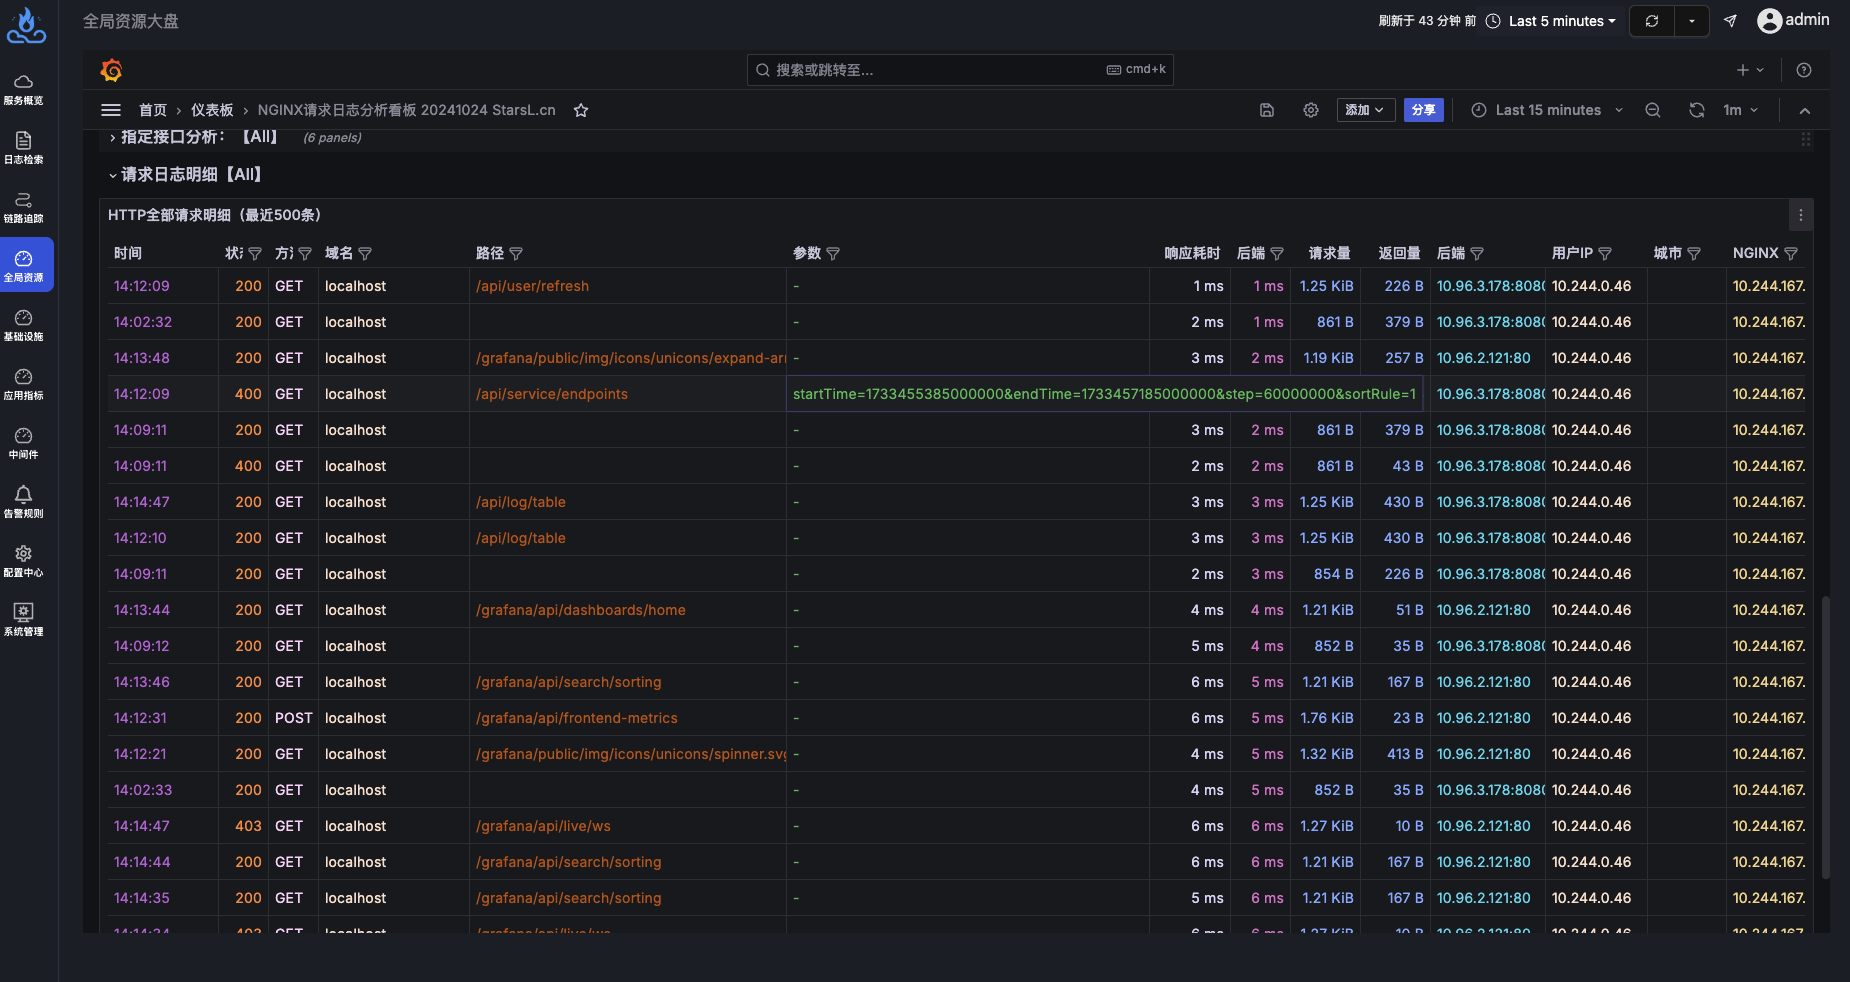
- Detailed Request Logs
Configuration Steps
Step 1: Modify NGINX Log Format
Open the NGINX configuration file (usually located at /etc/nginx/nginx.conf), and modify the log_format section as shown in the example below. Ensure this section matches exactly:
http {
    include       /etc/nginx/mime.types;
    default_type  application/octet-stream;

    log_format  main  '{"@timestamp":"$time_iso8601",'
                      '"client_ip":"$remote_addr",'
                      '"server_ip":"$server_addr",'
                      '"domain":"$server_name",'
                      '"request_method":"$request_method",'
                      '"path":"$uri",'
                      '"top_path":"$uri",'
                      '"query":"$args",'
                      '"request_length":$request_length,'
                      '"responsetime":$request_time,'
                      '"response_length":$body_bytes_sent,'
                      '"referer":"$http_referer",'
                      '"http_user_agent":"$http_user_agent",'
                      '"status":$status,'
                      '"upstreamhost":"$upstream_addr",'
                      '"upstreamtime":"$upstream_response_time"'
                      '}';
    access_log  /var/log/nginx/access.log  main;

    sendfile        on;
    #tcp_nopush     on;

    keepalive_timeout  65;

    #gzip  on;

    include /etc/nginx/conf.d/*.conf;
}
After making the changes, restart NGINX or execute the command nginx -s reload to apply the configuration.
Step 2: Collect NGINX Logs
In the Kubernetes cluster where apo-one-agent is installed, edit the ConfigMap named apo-ilogtail-user-config to add the configuration for collecting NGINX logs. Make sure to modify the LogPath to the path of your NGINX logs. Below is an example:
data:
  pod_stdout_all.yaml: |
    ...
  pod_stdout_file.yaml: |
    ...
  # The following are newly added configurations
  pod_log_file.yaml: |
    enable: true
    inputs:
      - Type: file_log
        LogPath: /var/log/nginx/
        FilePattern: "*.log"
        ContainerFile: true
    processors:
      - Type: processor_wait_for_signal
        DisableSignalSampler: true
        ContentsRename:
          "__tag__:_container_id_": "_container_id_"
          "__tag__:__path__": "_source_"
    flushers:
      - Type: flusher_http
        RemoteURL: http://apo-vector-svc:4310
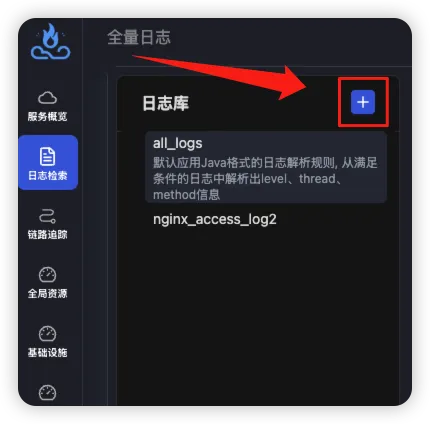
Step 3: Configure the Log Library on the APO Platform
Open the full log page on the APO platform, and click the + button in the "Log Library" section to add a new log library:
In the pop-up configuration page, follow these steps to configure:
- Fill in the "Log Library Name" as
nginx_access_log. - In the "Matching Rules" section, configure rules that can match NGINX logs, such as using
_source_=/var/log/nginx/access.logfor matching. - In the "Log Format Configuration" section, select "Structured Logs" and enter the following content in the text box:
{
  "@timestamp": "2024-12-06T06:44:17+00:00",
  "client_ip": "10.244.0.46",
  "client_region": "",
  "client_city": "",
  "client_latitude": 0.1,
  "client_longitude": 0.1,
  "server_ip": "10.244.167.148",
  "domain": "localhost",
  "request_method": "GET",
  "path": "/grafana/api/live/ws",
  "top_path": "/grafana/api/live/ws",
  "query": "-",
  "request_length": 1259,
  "responsetime": 0.010,
  "response_length": 10,
  "referer": "-",
  "http_user_agent": "Mozilla/5.0 (Macintosh; Intel Mac OS X 10_15_7) AppleWebKit/537.36 (KHTML, like Gecko) Chrome/131.0.0.0 Safari/537.36",
  "status": 403,
  "upstreamhost": "10.96.2.121:80",
  "upstreamtime": 0.009
}
- Finally, click "Save".
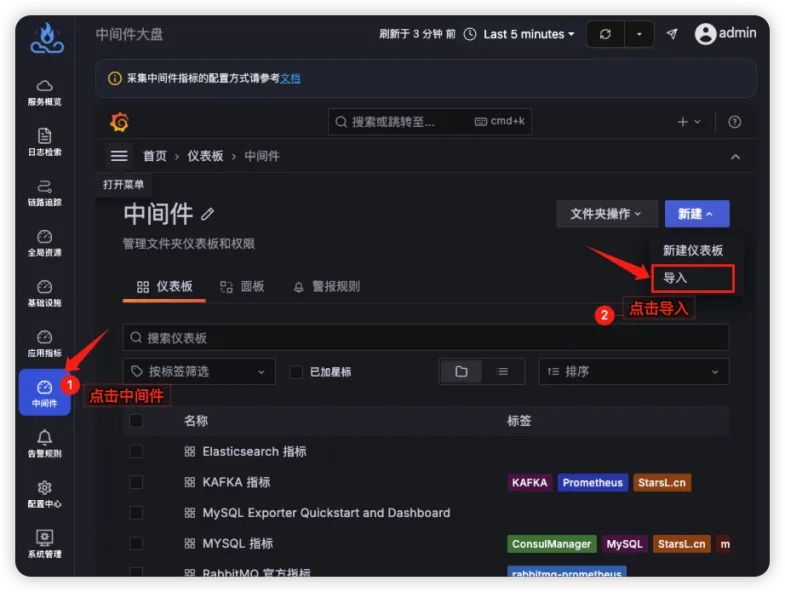
Step 4: Open the NGINX Dashboard and View Data
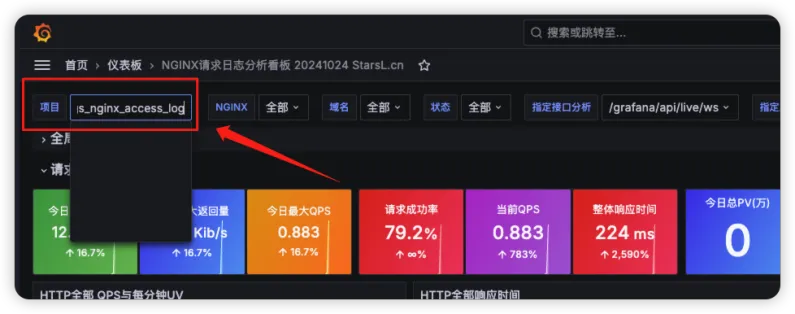
Open the "Middleware Dashboard" on the APO platform, and click on the "NGINX Request Log Analysis Dashboard" in the dashboard list:
In the "Project" filter box of this dashboard, select apo.logs_ninx_access_log (ensure it matches the log library name configured earlier):
Now, all steps are completed. Enjoy the cool NGINX request analysis dashboard!